There are no items in your cart
Add More
Add More
| Item Details | Price | ||
|---|---|---|---|

Candlestick patterns are one of the most essential tools for traders, providing deep insights into market trends and helping craft effective trading strategies. Before diving into the most important candlestick patterns, let’s briefly cover what a candlestick chart is and why it's such a critical tool for traders.
A candlestick chart originated in Japan during the 17th century and is widely used to track the movement of asset prices. These charts provide a clear visual of price fluctuations over a given period. Each candlestick represents four key data points:

Candlesticks are highly versatile and can be used to analyze price trends over various time frames—whether daily, weekly, monthly, or even as short as 1-minute intervals. This visual representation allows traders to spot potential opportunities more effectively than simply plotting prices along the x-axis of a traditional line chart.
Candlestick patterns are formed by sequences of candlesticks that signal either a continuation or a reversal of a trend. Traders rely on these patterns to help decide whether to buy, sell, or hold a position. Here are the top 5 candlestick patterns every trader must be familiar with.
The Hanging Man pattern forms during an uptrend and signifies potential bearish reversal. This pattern consists of a small body and a long lower wick, with the open price being close to the high price. The long lower wick indicates that sellers managed to push the price down significantly, even though buyers were able to bring it back up, signaling that the upward trend might be losing momentum. Traders often interpret this as a sign to prepare for a market downturn.

The Hanging Man pattern usually emerges when a security's price is in an uptrend. It indicates that investor interest may be declining, suggesting that holders could be preparing to sell, potentially leading to a price drop. This pattern is often interpreted as a sign of changing market sentiment, indicating a loss of upward momentum. However, it’s crucial to avoid making hasty selling decisions based solely on the appearance of a Hanging Man candlestick. Further analysis and confirmation are necessary before taking any action.
The Hammer pattern is very similar to the Hanging Man, but it occurs after a downtrend. It has a small body with a long lower shadow, signaling that buyers are starting to step in after a period of selling pressure. The Hammer shows that although sellers pushed the price to a new low during the session, buyers rallied toward the close, often marking the beginning of a bullish reversal.

When traders spot a Hammer candlestick, they often anticipate a potential trend reversal. This pattern typically forms during a declining asset price, suggesting that the market is attempting to find a bottom and may soon shift momentum. A Hammer candlestick indicates a day of significant market activity: the price drops after opening but rebounds to close higher than the opening price within the same trading period.
The placement of the Hammer also provides important clues. Traders view it as a stronger signal if it follows three or more consecutive bearish candles. Additionally, for the Hammer pattern to be confirmed, the next candle must close above the closing price of the Hammer itself. When these conditions align, traders consider it a compelling indication of a possible trend reversal and may decide to enter a long position.
It’s important to note that traders typically wait for the confirmation candle to make their market entry. However, like other candlestick patterns, the Hammer should not be relied upon in isolation; it’s crucial to consider it within the broader context of market trends and other technical indicators.
The Engulfing Pattern is one of the strongest reversal indicators, comprising two candlesticks where the second candle engulfs the body of the first. It comes in two variations:

Both versions of this pattern suggest a potential change in trend, making it one of the most reliable candlestick patterns for traders.
The Doji is a key candlestick pattern formed when the opening and closing prices are nearly the same, resulting in a candle with little to no body and both upper and lower wicks. This pattern indicates indecision in the market, as both bulls and bears fail to gain control, and is often a sign of a potential reversal.
A Doji pattern can appear in both uptrends and downtrends, signaling that the current trend may be weakening.
When a Doji appears on a candlestick chart, it signals a moment of indecision in the market, making it challenging for both new and experienced traders to determine their next move. Understanding this crucial candlestick pattern can significantly enhance your trading strategy and help you avoid costly mistakes.
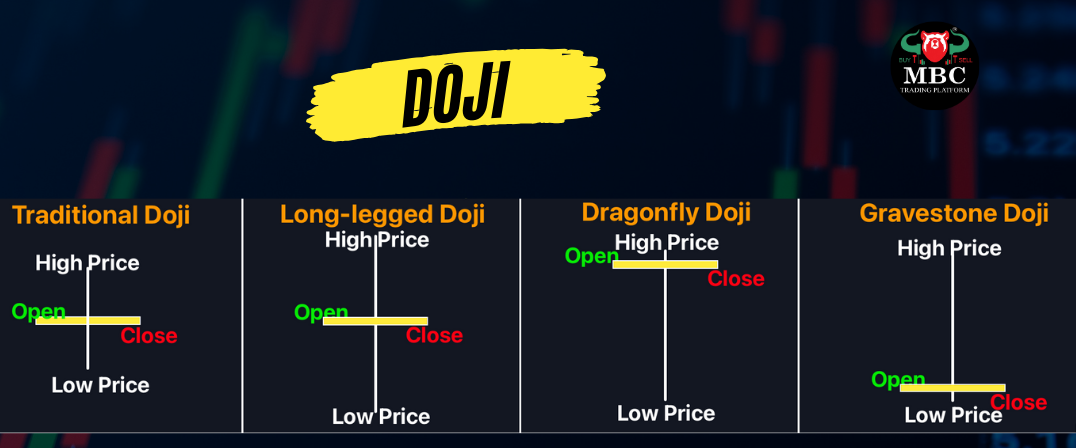
A Doji candlestick is inherently trend-neutral, meaning it doesn't directly indicate a trend reversal. However, when combined with other candlesticks on the chart, a Doji can serve as a confirmation of a potential change in trend.Each candlestick consists of four key components: the opening price, closing price, highest price, and lowest price for the trading period.
The relationship between the opening and closing prices forms the thick section of the candle, known as the body. A larger difference between these two prices results in a longer real body, while the highest and lowest prices create the shadows or wicks on either side. Analyzing these elements provides valuable insights into the asset's price movement and helps traders make informed decisions.
These patterns are typically formed by three candlesticks and indicate a reversal in market sentiment:

Mastering these top five candlestick patterns—Doji, Hanging Man, Hammer, Engulfing Pattern, and Morning/Evening Star—can give traders a powerful edge in the market. Recognizing these patterns allows traders to make more informed decisions, whether to enter, exit, or stay in a trade. By using candlestick charts effectively, traders can anticipate potential market shifts and better manage their investments. Always remember, candlestick patterns are not a guarantee, but they provide valuable insights into market psychology, allowing you to craft more strategic trading decisions.
Investing is a journey, not a sprint. Keep your focus sharp, stay committed, and watch your wealth grow through smart, informed decisions.
Team MBC
A Professional Stock market analyst & trainer in Rajamahendravaram, Andhra Pradesh.
 Launch your Graphy